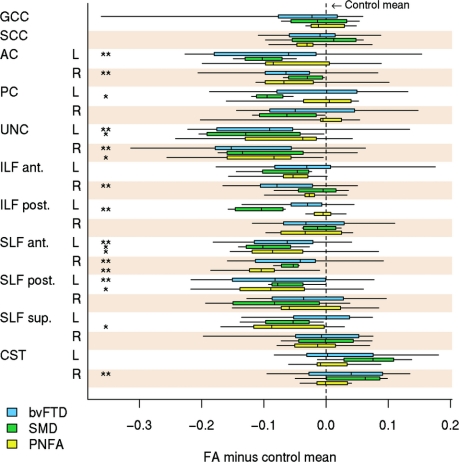
Figure 3 Box plots showing the distribution of fractional anisotropy values for the disease groups
To aid comparison, fractional anisotropy (FA) values were centered at the region of interest (ROI)–specific control group mean (defined as zero on the horizontal axis) and thus can be interpreted as differences between each disease group and controls for each white matter tract ROI. The boxes indicate the 25th, 50th (median), and 75th percentiles of the distributions, whereas the horizontal lines extending from the boxes stop at the most extreme data points. AC = anterior cingulate; ant = anterior; bvFTD = behavioral variant frontotemporal dementia; CST = corticospinal tract; GCC = genu of the corpus callosum; ILF = inferior longitudinal fasciculus; PC = posterior cingulate; post = posterior; PNFA = progressive nonfluent aphasia; SCC = splenium of the corpus callosum; SLF = superior longitudinal fasciculus; SMD = semantic dementia; sup = superior; UNC = uncinate fasciculus. * p < 0.10, ** p < 0.05 vs controls based on false discovery rate–corrected analysis of covariance p value.

