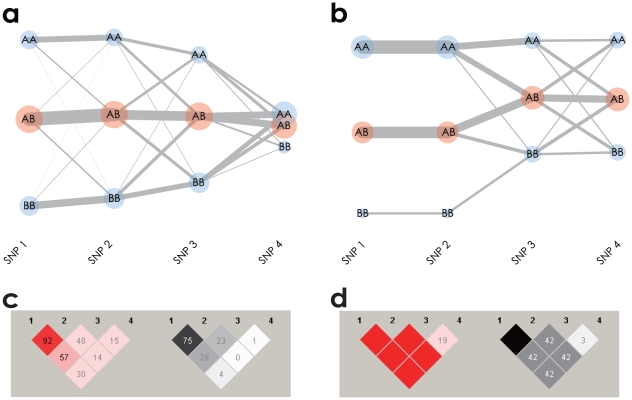
Figure 2. Textile plots and pariwise LD displays for simulated data.
(a) Textile plot shows LD between adjacent SNPs by means of crossing lines which tend to increase if the adjacent SNPs are in linkage equilibrium (LE) and decrease in LD. (b) Textile plot shows the absolute and complete LD by specific geometrical shapes. There exist the absolute LD between 1st and 2nd SNPs and the complete LD between 2nd and 3rd SNPs in contrast to the LE between 3rd and 4th SNPs. (c) Pairwise  (left) and
  (right) displays of the same data shown in (a). (d) Pairwise
  (left) and
  (right) displays of the same data shown in (b).

