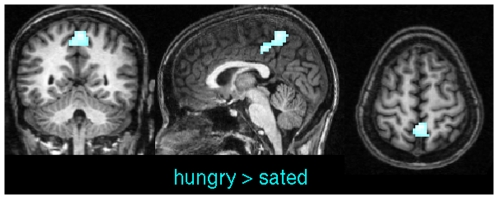
Figure 7. Pairwise t-test between sated and hungry subjects using scaled linear correlations in experiment 2.
Results are thresholded at  (corrected). Centrality values in precuneus were significantly higher during the hungry state. Other regions did not show significant effects. Talairach coordinates of slice positions are (−2,−50,56).

