
FIG. 3.
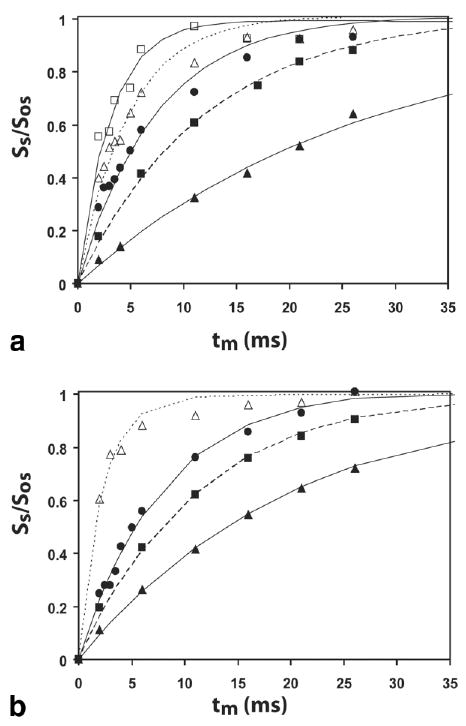
Experimental solute signal intensities for the WEX experiment as a function of pH, along with best fit using Eq. [7]. (a) SPD-5 experimental data were obtained at ▲ pH 5.6, ■ 6.3, ● 6.7, △ 7.0, and □ 7.6. (b) PLL experimental data were obtained at ▲ pH 6.0, ■ 6.5, ● 6.7, and △ 7.3.