
FIG. 8.
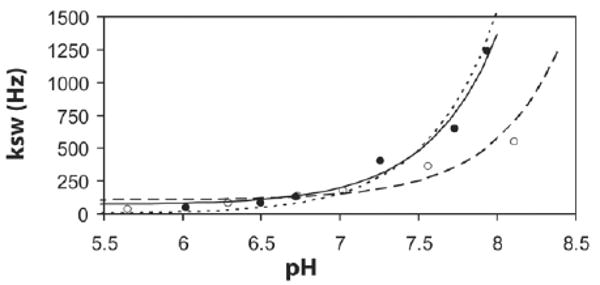
Dependence of the proton exchange constant on pH at T = 37°C for the two different contrast agents: PLL, SPD-5. Exchange rates are the average of those obtained by the four different measurements, and lines are the best fits using Eq. [9]. For PLL the solid line represents our fit (–), and the dashed line(---) represents the fit using constants found in Bai et al. (40) translated to 37°C as described in this reference. For SPD-5 the line (– –) is our best fit.