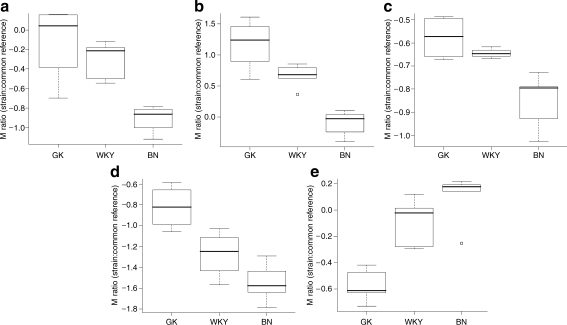
Fig. 3.
Box plots of expression in strains GK, WKY and BN (relative to a common reference) for five miRNAs whose expression was consistent with glycaemic status. The pattern GK>WKY>BN was observed for miR-27a (a) and miR-222 (b) in adipose tissue, and for mir-103 (c) and miR-195 (d) in liver, whereas GK<WKY<BN was observed for miR-10b in muscle (e). Circles represent outliers

