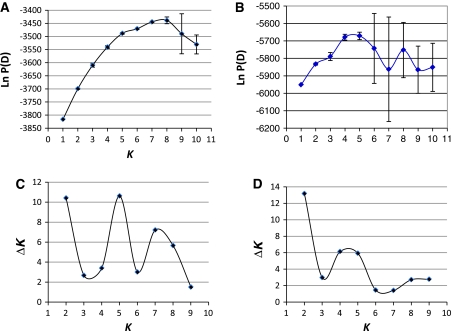
Fig. 4.
Graphs a and b: Mean posterior probabilities, Ln P(D), averaged across 10 runs, for the data set comprising 132 fig genotypes, for different K ranging from 1 to 10, considered for the estimation of the number of subpopulations, with and without consideration to the number of groups identified in the distance based cluster analysis, respectively. Graphs c and d: Second order rate change with respect to K (∆K) as a function of K computed based on the posterior probabilities averaged across 10 replicates with and without considerations to the number of groups identified in the distance based cluster analysis, respectively

