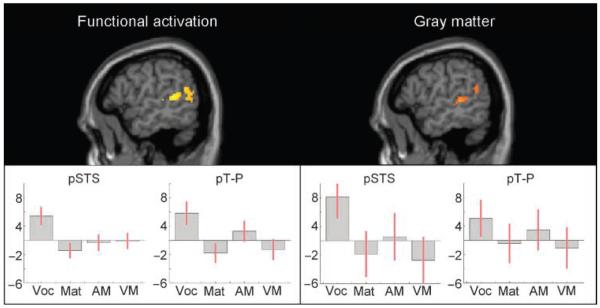
Figure 1.
Analyses across lifespan. Lifespan analyses results showing the left pSTS and the left pT-P for functional and structural analyses, respectively. Graphs plot the effect of each of the following regressors upon brain activation (functional) and gray matter (structural): vocabulary (Voc), matrices (Mat), auditory memory for sentences (AM), and visual memory for sentences (VM) on each region. The y-axis shows effect sizes as the percentage increase relative to the global mean. The red bars are the 90% confidence intervals.

