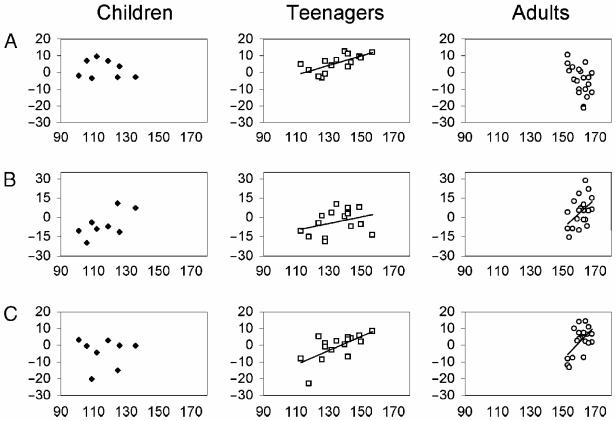
Figure 3.
Scatter plots according to age group showing the relationship between vocabulary score (x-axis) and gray matter density (y-axis). Trajectories are plotted only where a statistically reliable relationship was observed. (A) Left pSMG [x = −40, y = −54, z = 52], where there is prominent trend for teenagers over and above all other age groups; (B) the left pSTS [x = −48, y = −36, z = 6], where the trajectory for adults appears steeper than those of children and teenagers (this positive correlation was marginally significant for children, p = .07). It should be noted that the trajectory for adults remains statistically reliable after the omission of two outliers; (C) the left pT-P [x = −50, y = −60, z = 16], where there is a consistent trend for both teenagers and adults.

