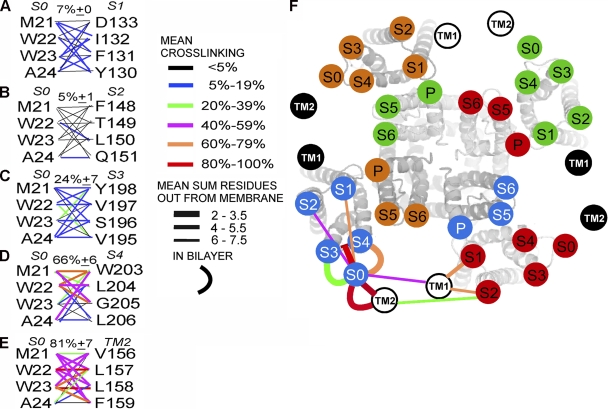
Figure 2.
Extents of endogenous disulfide bond formation between S0 and S1 through S4 and between S0 and TM2. (A–E) In the left column, the four residues substituted by Cys in the first helical turn in the membrane of S0 are shown, and the four residues substituted in (A) S1, (B) S2, (C) S3, (D) S4, and (E) TM2 are in the right column. The mean extents of disulfide bond formation between Cys are represented by connecting lines color-coded according to the legend. The means of the top three extents of cross-linking are shown above each set of lines. (F) Face-on view of the Kv1.2/Kv2.1 chimera S1–S6 with superimposed, labeled circles, uniquely colored for each subunit, representing the approximate locations of the extracellular ends of BK α S1–S6. Circles representing the extracellular ends of BK α S0 and of β1 TM1 and TM2 are located relative to S1–S6, based on the extents of cross-linking between Cys in the extracellular flanks (straight lines) and on the extents of cross-linking between Cys in the membrane (curved lines). The lines are color-coded for the mean extent of cross-linking (mean of the top three pairs) and coded by line thickness for the extracellular cross-links by the mean sum of the number of residues that the two Cys’s are out from the membrane. The closer the cross-links between the extracellular flanks are to the membrane, the thicker the line.

