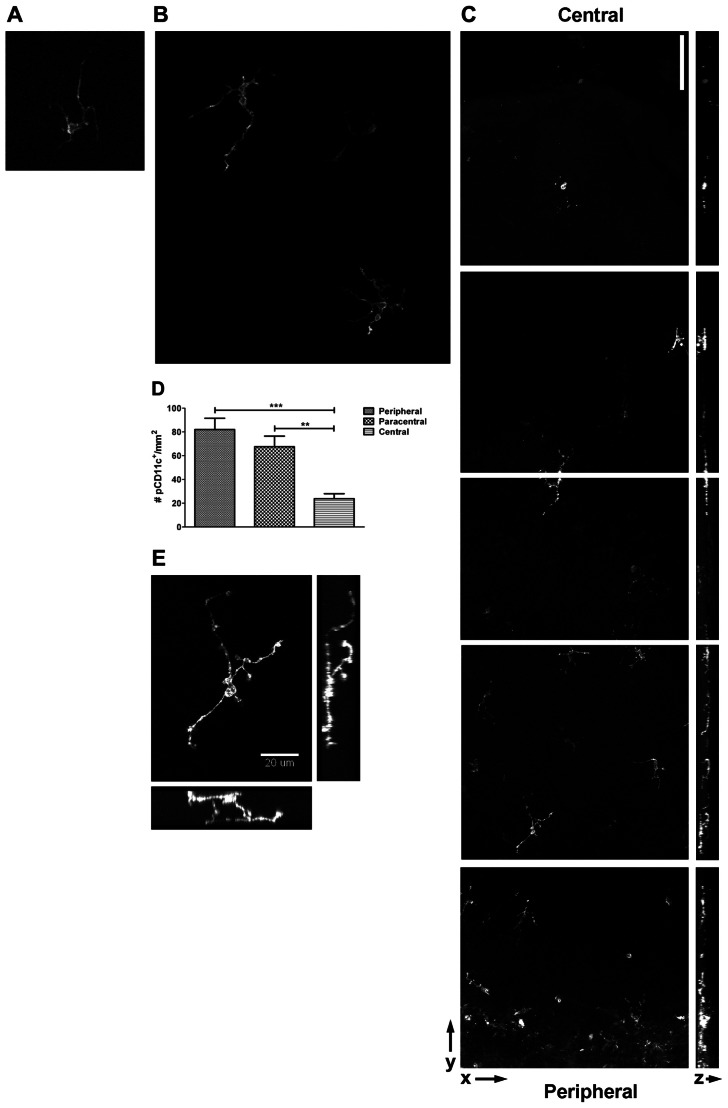
Figure 1. Detection of CD11c-expressing dendritic cells in live and fixed corneas.
A) Corneas of live anesthetized alb/c mice expressing EGFP from the CD11c promoter were imaged with a hand-held confocal microscopic probe. Original magnification, ~20X. B) Corneas of live anesthetized Balb/c mice expressing EGFP from the CD11c promoter were imaged on an inverted two-photon confocal microscope. Original magnification, 40X. C–E) Corneas from Balb/c mice expressing EGFP from the CD11c promoter were excised and corneal whole mounts were imaged through the entire thickness of the tissue. C) Montage of images spanning from center (top) to peripheral (bottom) cornea. Left: Single plane 3D reconstructions of stacks through the entire thickness of the cells. Right: The full-thickness stacks were reconstructed in the yz plane, with the epithelium to the left and the endothelium to the right. Bar, 75 μm. D) Plot of the density of EGFP+ DCs in the peripheral, paracentral, and central regions of the noninflamed cornea. Numbers calculated by counting the number of cells per field and adjusting it to the number per mm. ANOVA analysis revealed significant differences between the density of DCs in peripheral versus central (***, 95% CI = 28.71 to 87.56) as well as paracentral versus central (**, 95% CI = 14.29 to 73.15) regions of the cornea. E) High resolution image of a single EGFP+ DC shown as a single-plane 3D reconstruction of images through the entire thickness of the cell as well as en face views.

