
Figure 4.
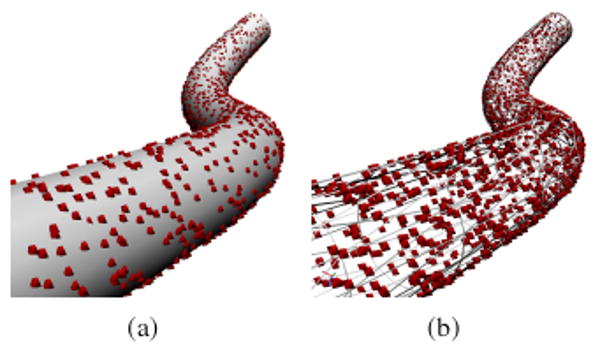
Uniform random sampling of a curvilinear tube. Spheres represent fluorophores (not to scale) generated from (a) surface labeling and (b) volume labeling. The surface of the tube on the right is represented in wireframe to make the internal fluorophores visible.