
Figure 6.
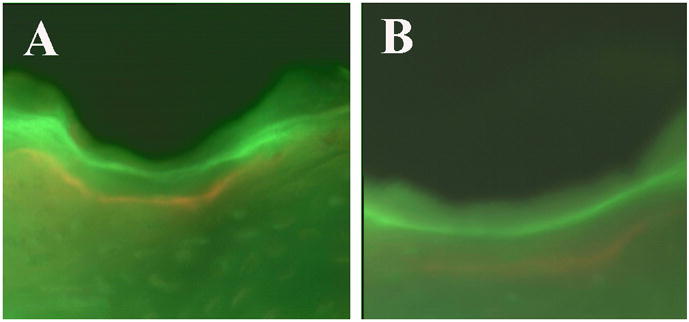
Fluorescent microscopy images (200X) were used to measure the mineral apposition rate. The fluorochrome labels, calcein (green) and xylenol orange (orange) can be observed near the metallic implant (black) at six weeks in a large pore titanium foam implant (A) and in a sintered beaded implant (B).