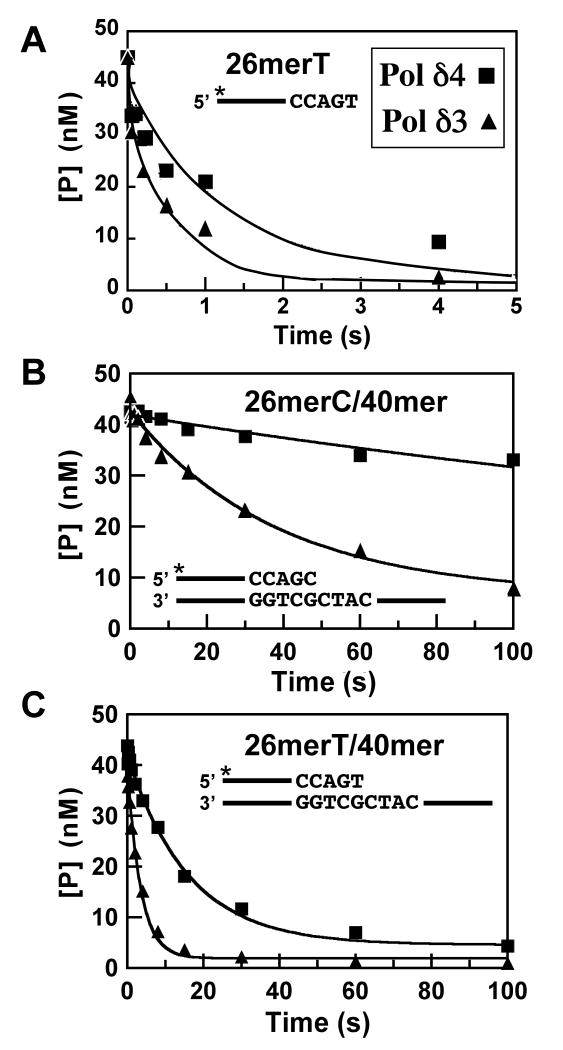
FIGURE 4.
Determination of the rates of exonuclease cleavage of ssDNA and dsDNA by Pol δ4 and Pol δ3. Reactions were performed as described in Experimental Procedures using a rapid quench apparatus under single turnover conditions. The final reactions contained Pol δ3 or Pol δ4 (100 nM p125) and 50 nM DNA substrate. Reactions were initiated by addition of 10 mM Mg2+, and quenched at various times (from 0.05s to 150s). The remaining 26mer was determined and the data were fit into an exponential decay equation (Equation 5), and yield observed rates of excision. (A) Time course of hydrolysis of a 26mer ssDNA DNA, [5′-32P]26merT, by Pol δ4 (squares) and Pol δ3 (triangles); values for the rates are given as kexo in Table 1. (B) Time course of hydrolysis of a 26mer/40mer duplex DNA, [5′-32P]26merC/40mer, by Pol δ4 (squares) and Pol δ3 (triangles); values for the rates are given in Table 1 as the rates for switching of the primer terminus from the pol to the exo site (kpol-exo, Scheme I). (C) Time course of hydrolysis of a 26mer/40mer duplex DNA containing a mismatched primer terminus, [5′-32P]26merT/40mer, by Pol δ4 (squares) and Pol δ3 (triangles); values for the rates are given in Table 1 as the rates for switching of the primer terminus from the pol to the exo site (kpol-exo, mismatch).

