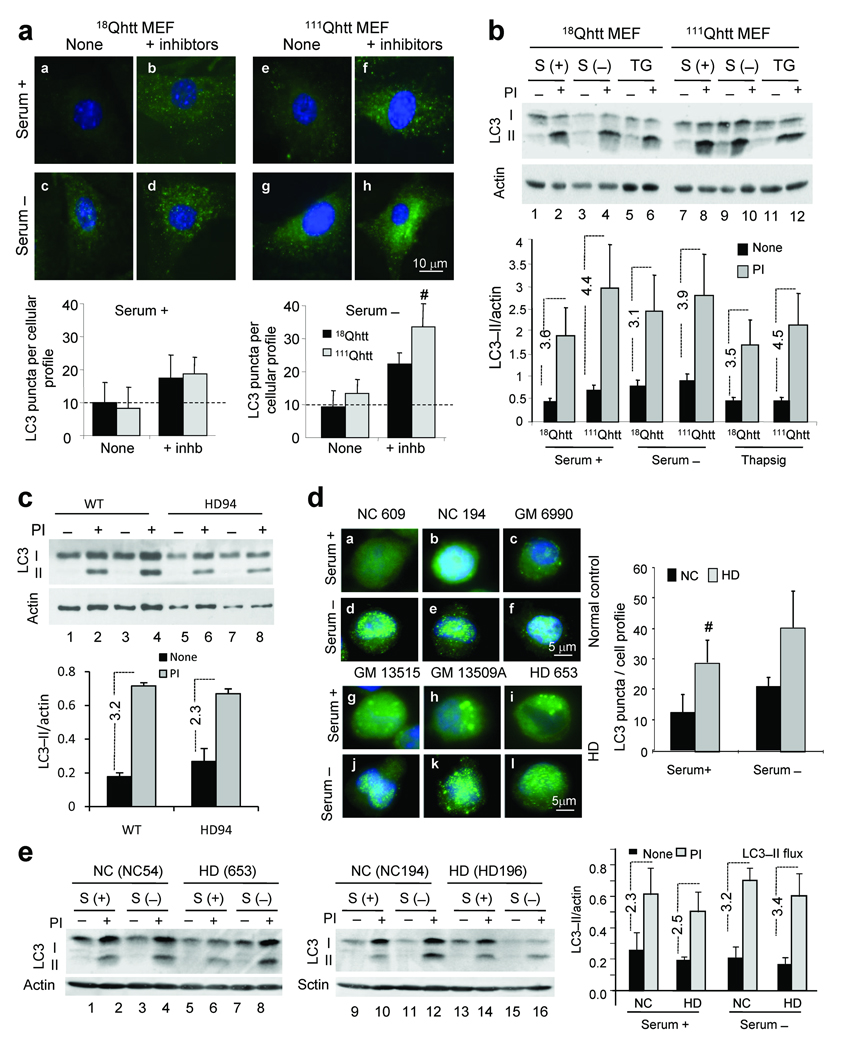
Figure 2. Formation and clearance of autophagic vacuoles is normal in HD cells.
(a) LC3 immunostaining of 18Qhtt and111Qhtt MEFs maintained in the presence (+) or absence (−) of serum and lysosomal proteolysis inhibitors. Bottom: mean number per cell (left) and average size (right) of LC3 positive vesicles. n = 4 (b) LC3 immunoblot in the same cells after serum removal or thapsigargin (TG) treatment. PI: protease inhibitors. Bottom: LC3–II levels and LC3–II flux (dotted lines). N = 4. (c) LC3–II values and LC3–II flux (dotted lines) in neuronal cultures from wild type (WT) or HD94 mice (HD) grown over wild type rat astrocyte monolayers analyzed as in b. n = 4. (d) LC3 staining of lymphoblasts from 3 normal control (NC) or HD patients maintained in the presence or absence of serum. Right: mean number of LC3 positive vesicles. Extended study in Supplementary Fig. 8b,c. (e) LC3–II levels in NC and HD lymphoblasts treated or not with protease inhibitors. Right: LC3–II values and LC3–II flux (dotted lines). Extended study in supplementary Fig. 8a. Values are all expressed as mean+s.d. Differences with control, where significant, are indicated with # for p < 0.05. Full–length blots are presented in Supplementary Fig. 20.

