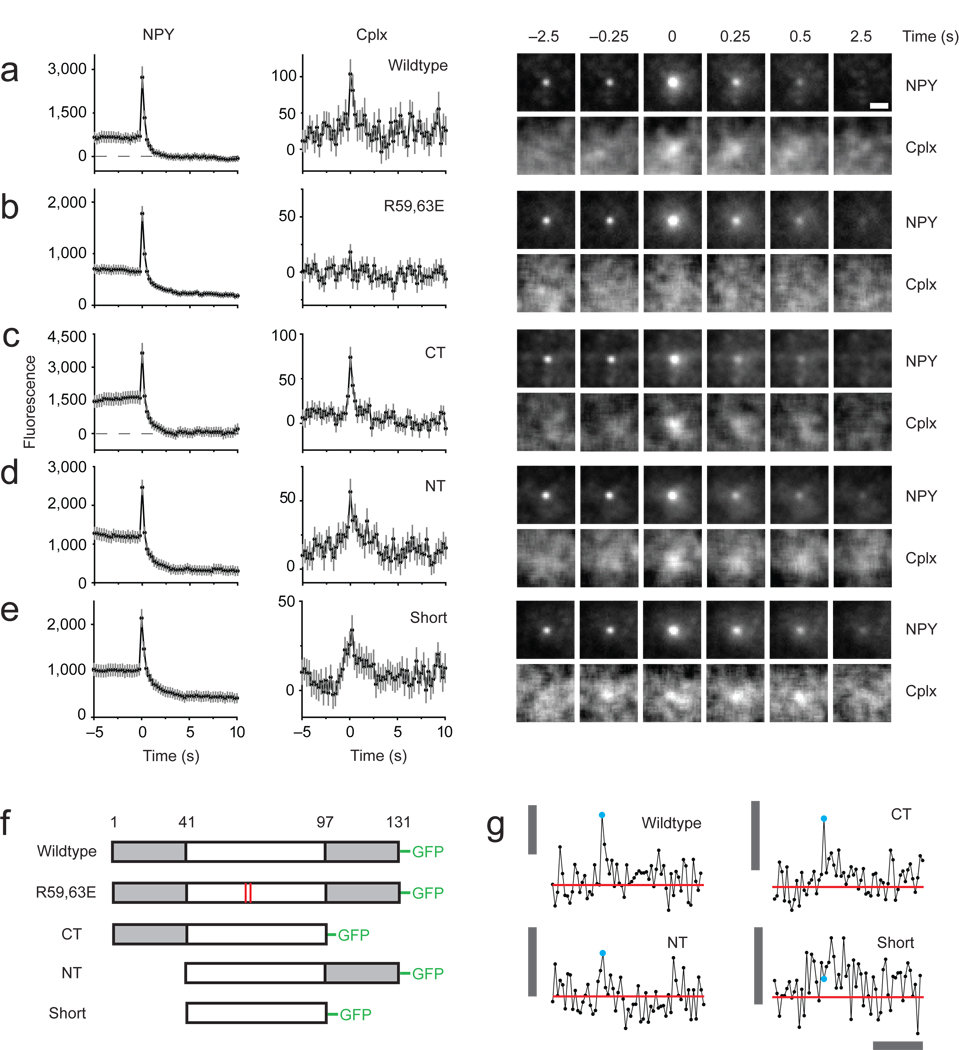
Figure 1.
Imaging secretory granules labeled with NPY-mRFP undergoing exocytosis in PC12 cells coexpressing different versions of cplx-GFP. (a–e) Images (right) are averages of events time-aligned to the moment of fusion: wildtype (n = 94 events, 11 cells), R59,63E (n = 139 events, 16 cells), ΔCT (n = 85 events, 10 cells), ΔNT (n = 144 events, 18 cells), ‘short’ (n = 123 events, 12 cells). The fluorescence intensity (left) was calculated by taking the average intensity within a 1.2-µm circle centered on a granule, or the corresponding coordinates in the cplx channel, and subtracting the average intensity within a concentric 1.3-µm wide annulus, which served as the local background fluorescence; intensities were plotted against time and then averaged. Exocytosis was stimulated by perfusion with a solution of elevated [K+]. 3–6 transfections were performed per condition. Scale bar, 1 µm. Error bars are ± s.e.m. (f) Schematic diagram of cplx-GFP fusion proteins. (g) Examples of cplx-GFP signals associated with single fusion events. Cyan circle indicates when fusion occurred. Red line is the average intensity in the trace 3–5 s before fusion. Vertical bar, 200 fluorescence units; horizontal bar, 5 s.

