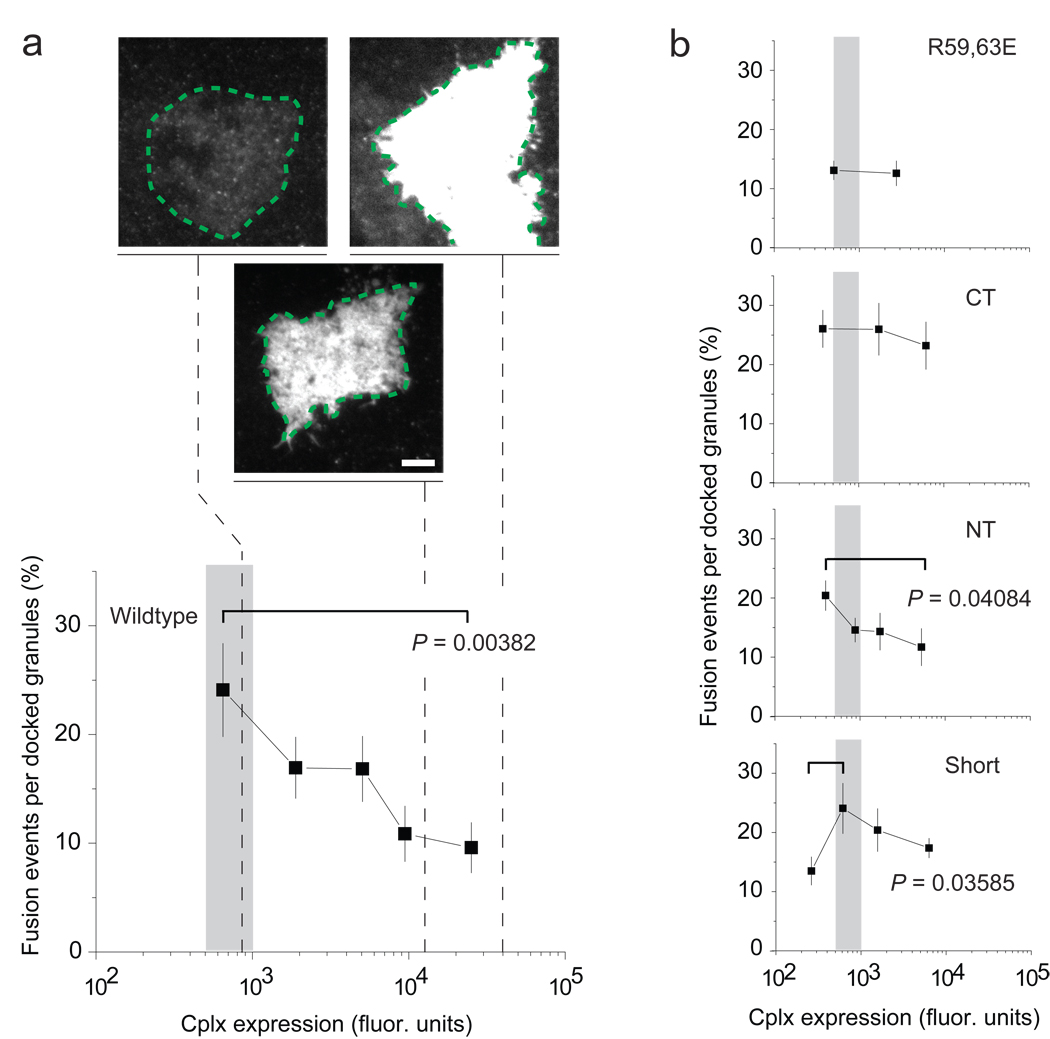
Figure 2.
Effect of cplx overexpression on NPY-mRFP exocytosis. (a) Plot of fusion events (% of docked granules) versus cplx expression level. The recording period was 3.33 min. The spatially averaged cplx-GFP fluorescence of the ‘footprint’ of the cell, where the cell adhered closely to the coverslip (green dashed lines), served as a measure of expression. The cplx expression levels of cells required for detecting SNARE complexes (see Fig. 1) fell within the range indicated by the shaded area (~500–1,000 fluorescence units). Representative footprints are shown at the same contrast setting to illustrate the differences in the brightness of transfected cells. Scale bar, 10 µm. (b) As in a, but for other cplx constructs. All points are the average of a 20-cell bin, except for the rightmost point in each plot, which represented the following number of cells: 17 (wildtype), 15 (R59,63E), 15 (ΔCT), 24 (ΔNT) and 18 (short). 3–8 transfections were performed per condition. Error bars are ± s.e.m. P values determined using a Student’s t-test.

