Figure 3.
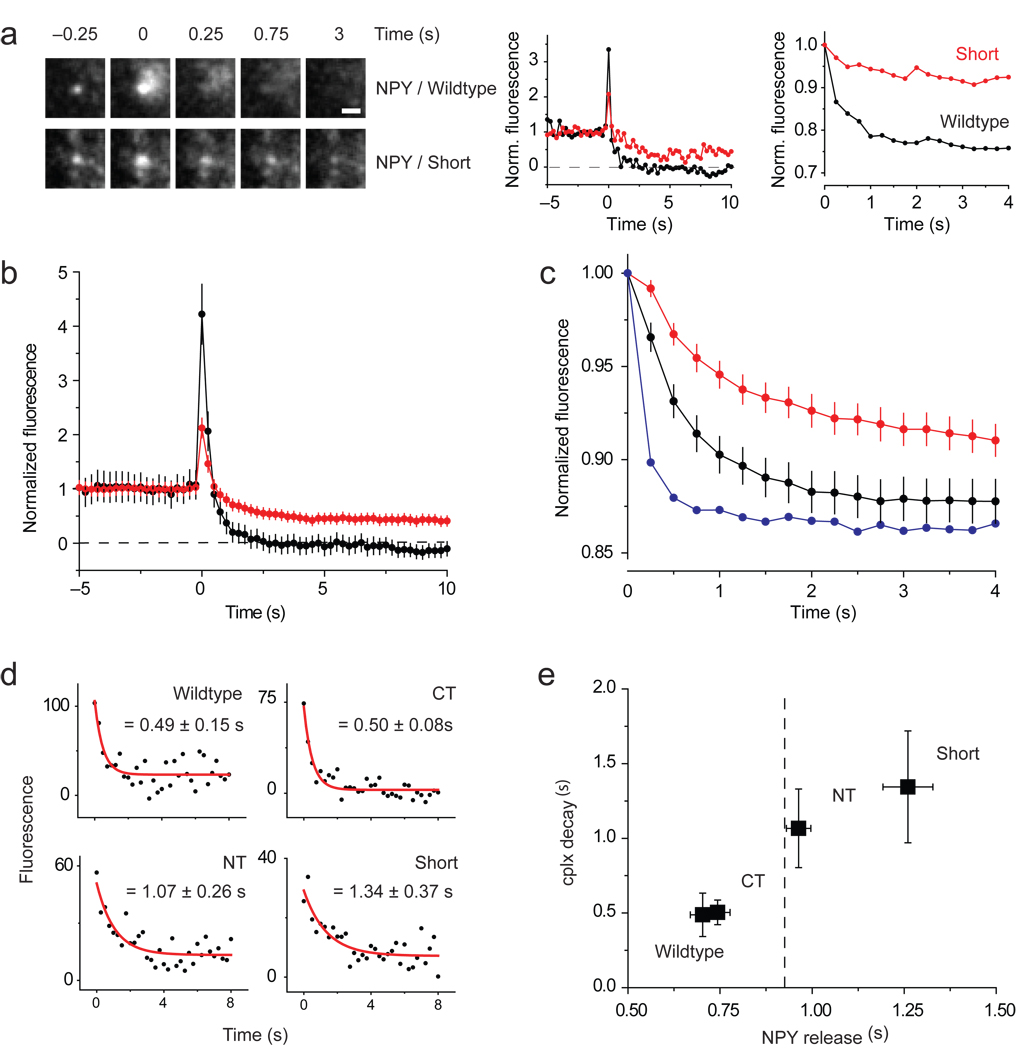
Slow and incomplete release of NPY-mRFP when cplx persists during fusion. (a) Images (left) of granules releasing NPY-mRFP completely with wildtype cplx-GFP or incompletely with cplx short-GFP. Scale bar, 1 µm. (Middle) Background-subtracted fluorescence of same granules, normalized to the intensity during the last 2 s before fusion. (Right) Average fluorescence within larger, 2.5-µm–diameter circles centered over same granules, normalized to the intensity when fusion occurred. This ‘outer-circle’ fluorescence analysis is a better measure of the rate of NPY-mRFP release, since it minimizes diffusional loss outside of the region of interest. (b) Averages of background-subtracted NPY-mRFP fluorescence traces in Figure 1a,e normalized to pre-fusion intensity. Black trace, wildtype cplx-GFP; red trace, cplx short-GFP. The NPY-mRFP trace with cplx short-GFP is less noisy because it is an average of more events. (c) Averages of outer-circle NPY-mRFP fluorescence traces of the events in b normalized to initial-fusion intensity. Black trace, wildtype cplx-GFP; red trace, cplx short-GFP; blue trace, average of 5 events from wildtype cplx-GFP cells showing fastest loss of NPY-mRFP fluorescence, indicating that NPY-mRFP diffusion is unhindered within the space underneath the cell. (d) Averaged cplx-GFP signals (from Fig. 1) fitted to single exponential decay from fusion onset. (e) Plot of cplx-GFP decay times in d and rates of NPY-mRFP release measured with the outer circle fluorescence analysis in c. Dashed line, rate of NPY-mRFP release (0.93 ± 0.05 s) with the R59,63E-GFP mutant.

