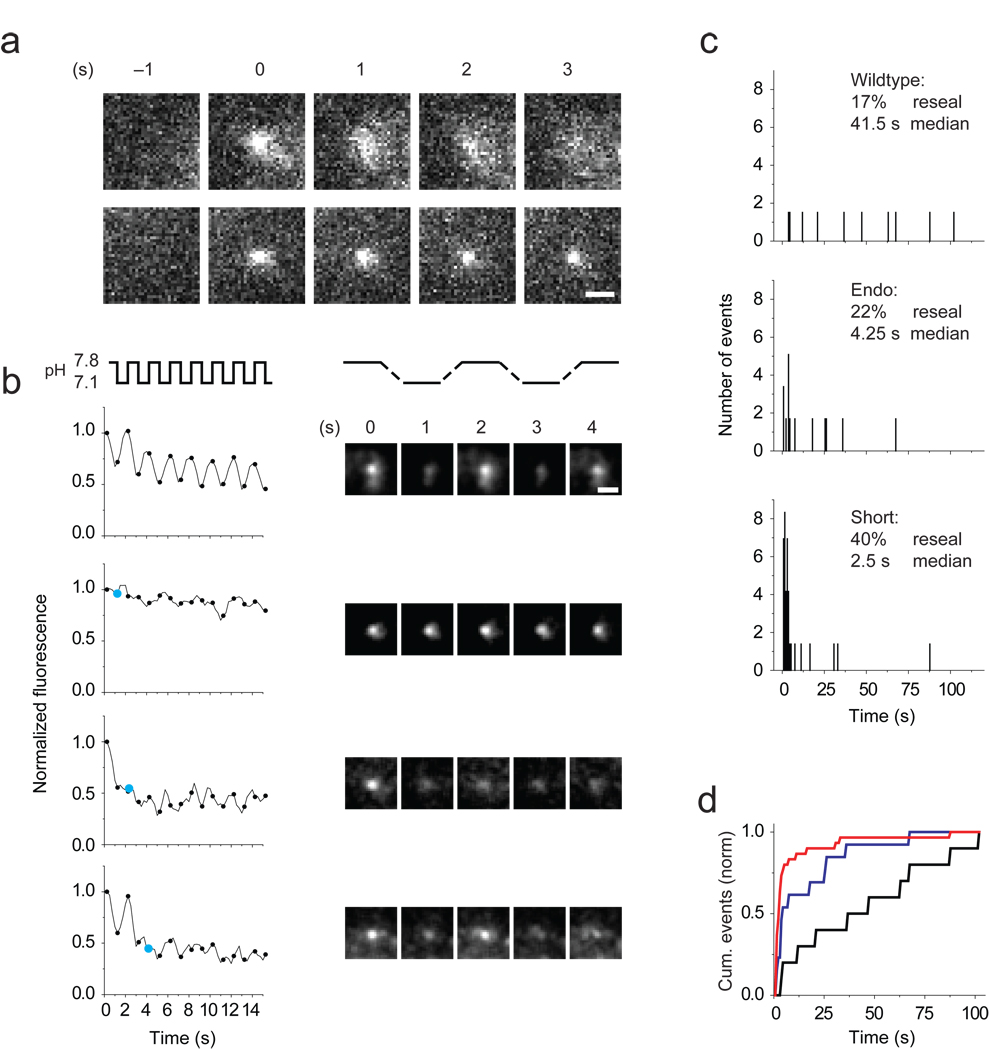
Figure 4.
Rapid resealing of granules with persisting cplx. (a) Images (left) of granules labeled with tPA-phluorin spreading (top) or remaining compact (bottom) during exocytosis. Note that phluorin is completely acid-quenched at −1 s before fusion occurs. (b) Monitoring granule resealing by alternating the external pH once a second (4 frames). Plots of background-subtracted fluorescence of granules (left) once they become visible through exocytosis. For clarity, only time points marking the end of a pH pulse are shown (black circles), starting 750 ms after fusion. Events were plotted as rolling averages of three frames to reduce noise. In bottom three events, cyan circles mark the end of the pulse when resealing occurred. Image sequence (right) of the granules analyzed in the left plots. Scale bar, 1 µm. (c) Distribution of resealing times with wildtype cplx-mRFP (17% of 60 granules; median time 41.5 s), endogenous cplx (22% of 59; 4.25 s) and cplx short-mRFP (40% of 70; 2.5 s). For each condition, more than 10 cells in 2–4 transfections were analyzed. (d) Cumulative frequency distributions of resealing times. Black trace, wildtype cplx-mRFP; red trace, cplx short-mRFP; blue trace, endogenous cplx. P<0.001, Kolmogorov-Smirnov tests.

