Figure 5.
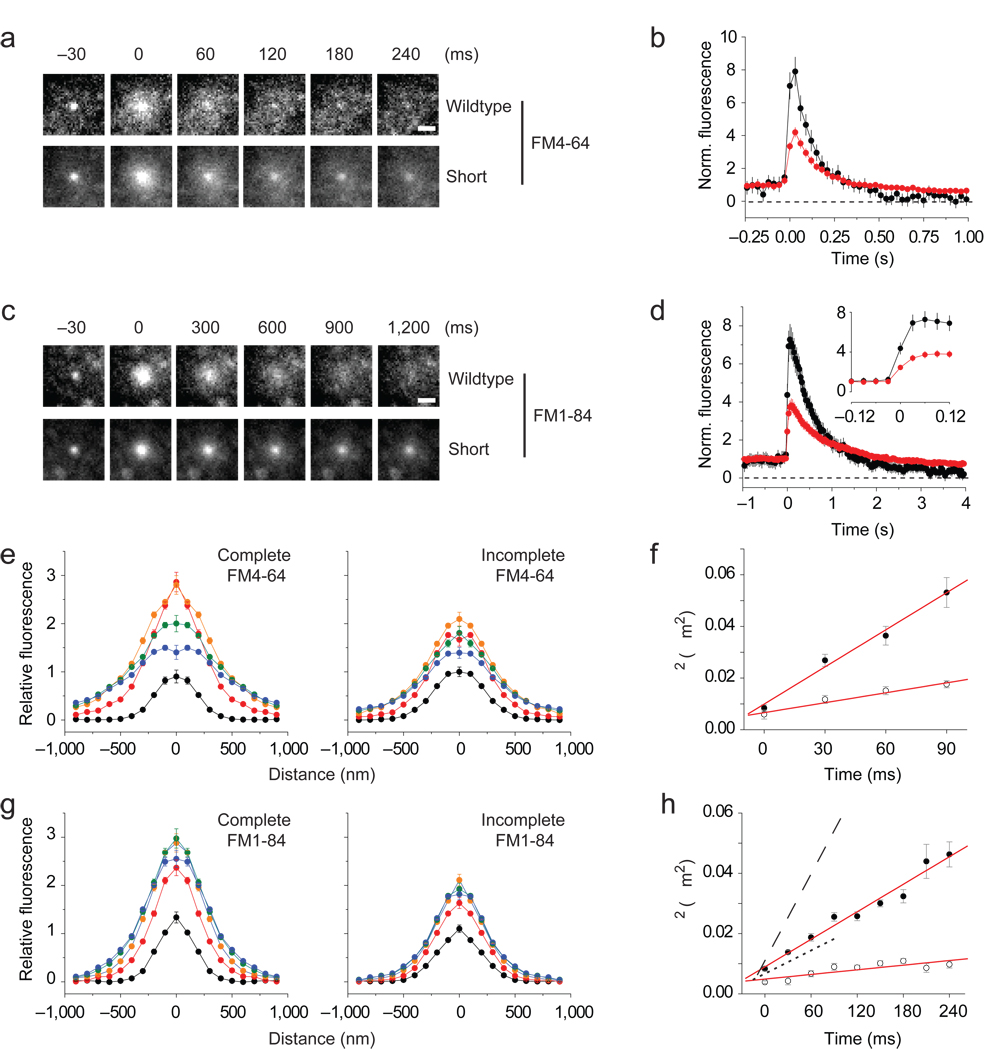
Restricted lateral diffusion of FM dyes with persisting cplx. (a) Averaged image sequence of FM4-64 release with wildtype cplx-GFP (n = 37 events, 7 cells) or cplx short-GFP (n = 78 events, 16 cells). The increase in fluorescence upon fusion is due to changes in the proximity of the dye to the glass interface, as well as changes in the dye’s orientation in the membrane. Scale bar, 1 µm. (b) Plots of background-subtracted FM4-64 fluorescence of granules, normalized to pre-fusion intensity. Black trace, wildtype cplx-GFP; red trace, cplx short-GFP. (c,d) As in a and b, but with FM1-84 (wildtype cplx-mRFP, n = 34 events, 8 cells; cplx short-mRFP, n = 105 events, 22 cells). Inset, traces shown at an expanded timescale. (e) Fluorescence profiles of averaged complete and incomplete FM4-64 release events at selected times relative to fusion (black circles, 30 ms; red circles, 0 ms; orange circles, 30 ms; green circles, 60 ms; blue circles, 90 ms). Images of analyzed events are shown in Supplementary Figure 11.(f). Timecourse of σ2, the square of the width of Gaussian curves (see Methods). The slope of each line corresponds to an apparent diffusion coefficient (solid circles: complete release, 0.45 µm2/s; open circles: incomplete release, 0.15 µm2/s). (g,h) As in e and f, but with FM1-84 (solid circles: complete release, 0.15 µm2/s; open circles: incomplete release, 0.03 µm2/s). For comparison, complete and incomplete timecourses of σ2 with FM4-64 are replotted as dashed and dotted lines, respectively.

