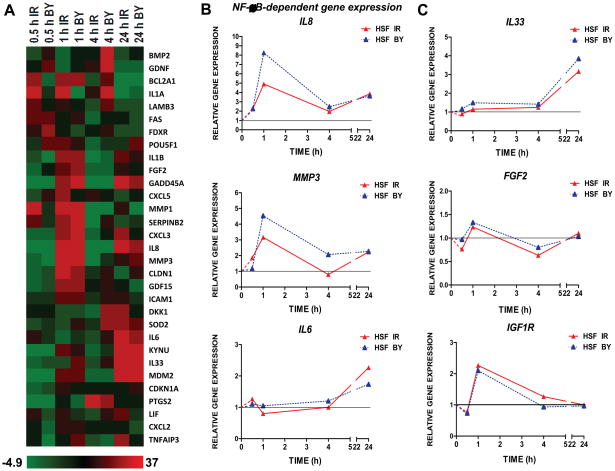
Fig. 3.
Relative gene expression in α-irradiated and bystander HSF 0.5–24 h after treatment. (A) Heatmap of gene expression levels across the time course of 0.5, 1, 4 and 24 h in directly irradiated and bystander cells as measured by low density qPCR array. (B) Expression of IL8, MMP3 and IL6 in HSF in directly irradiated (red triangles) and bystander cells (blue triangles) at 0.5, 1, 4, and 24 h after irradiation, relative to time-matched controls and normalized to UBC. Gene expression was determined by quantitative real time PCR. (C) Relative gene expression changes in IL33, FGF2 and IGF-R1 were determined by quantitative real time PCR.

