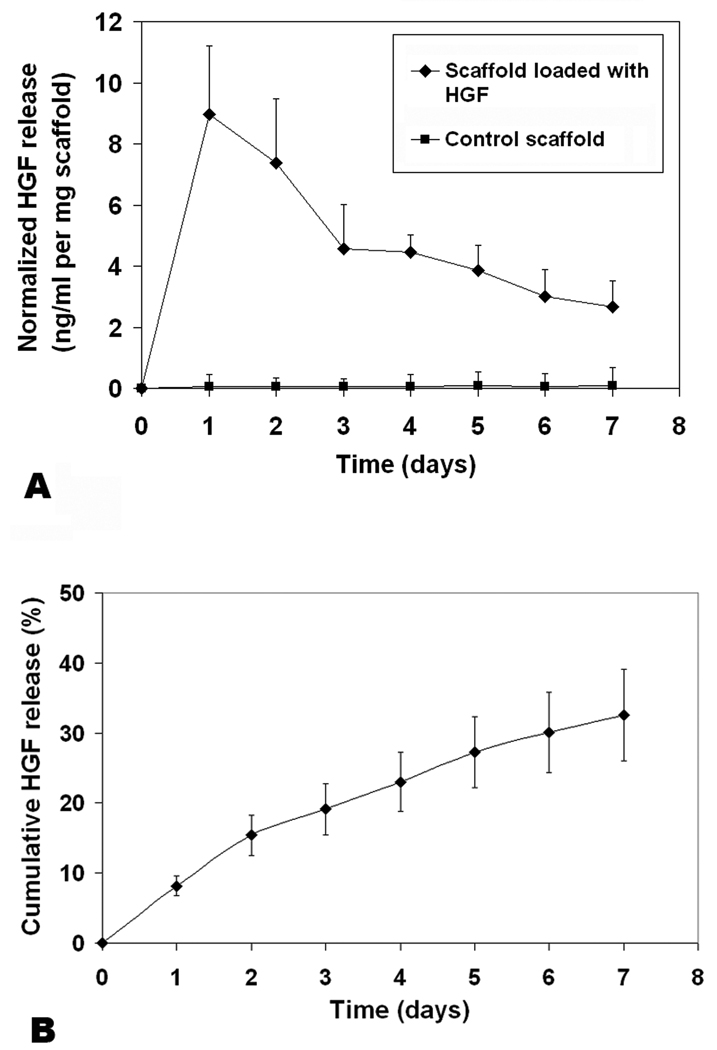
Figure 2.
(A) Profiles of hepatocyte growth factor (HGF) released from bovine acellular scaffolds loaded with HGF (9.01 ng HGF per mg scaffold) and from control scaffolds without HGF as a function of time (n = 5). Normalized concentration of HGF released (ng/ml per mg scaffold) is shown on the y-axis. (B) Cumulative levels of HGF released from the HGF-loaded scaffolds as a function of time (n = 5). Percentage of the HGF released with reference to the total HGF loaded is shown on the y-axis.

