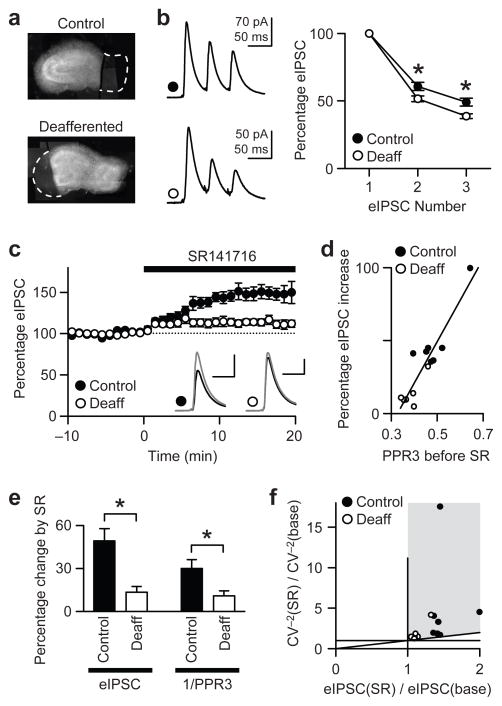
Figure 7.
Deafferentation of CA1 decreases tonic CB1R activity and increases basal GABAergic Pr, mimicking chronic TTX treatment. All slice cultures were incubated with ω-agatoxin IVA (300 nM) for 15–30 min prior to recording. (a) Micrographs of cultures from which CA3 or subiculum had been removed. CA3 removal eliminates afferent excitation of CA1 neurons, whereas subiculum removal serves as control. Dashed lines indicate the areas removed. (b) Short-term eIPSC depression (20 Hz) is more pronounced in deafferented slices than in control slices. Recordings were made 5–7 days after the cut. *, P < 0.05. (c) The increase in eIPSCs caused by SR141716 (2 μM) is larger in control cells than in deafferented cells (P < 0.005). Black trace, baseline; gray trace, SR141716. Amplitude scales, 50 pA for control and 100 pA for deafferented. Time scales, 30 ms. (d) When basal Pr is lower, as represented by higher PPR3 before SR141716, the SR141716-mediated increase in eIPSCs is larger. The line is a linear regression fit (R2 = 0.84). (e) The larger enhancement in eIPSC amplitudes caused by SR141716 in control cells than in deafferented cells is accompanied by a larger increase in PPR3−1. Data in b and c were analyzed. *, P < 0.05. (f) From the data in c, the ratio of CV−2 in SR141716 to baseline CV−2 [CV−2(SR)/CV−2(base)] is plotted against the ratio of eIPSCs. Points in gray area and along the diagonal line suggest presynaptic enhancement of transmission.

