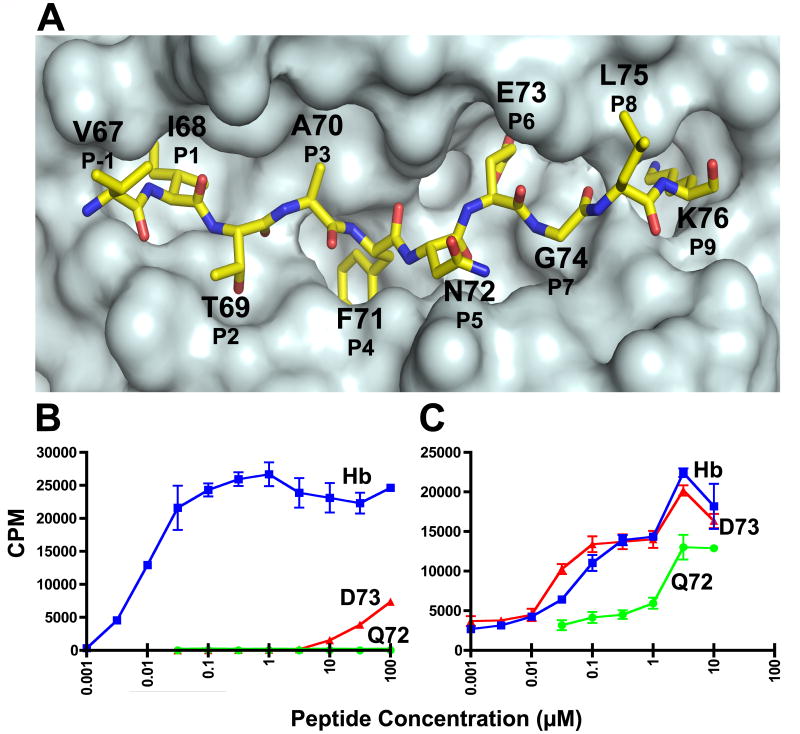
Fig. 1.
T cell response of the 3.L2 T cell and the high-affinity M15. A. A top view of the surface of the crystal structure of Hb/I-Ek showing the anatomy of the Hb peptide. A surface was generated for the I-Ek molecule without the Hb peptide, and then a representation of the Hb peptide was superimposed onto the surface. Each amino acid position of the peptide is designated by the amino acid using the one letter code, the residue number found in the Hb protein chain, and standard peptide register number. There are 4 MHC anchor residues (P1, P4, P6, and P9) and 4 TCR contact residues (P2, P3, P5, and P8). B. The response of the 3.L2 T cell to Hb, D73, and Q72, and C. the response of M15 to Hb, D73, and Q72. T cell hybridoma cells were stimulated by indicated peptide concentrations for 24 hours in the presence of CH27 antigen presenting cells. The level of simulation was assayed by 3H-TdR incorporation into the IL-2 dependent cell line, CTLL-2. The values represent the mean ± triplicate values. Representative experiments of > 3 are shown. Please note, we have published identical findings, but different experiments, of these same T cells and peptides (Donermeyer et al., 2006; Weber et al., 2005). These data are provided to establish the biological responses that are investigated in this study.

