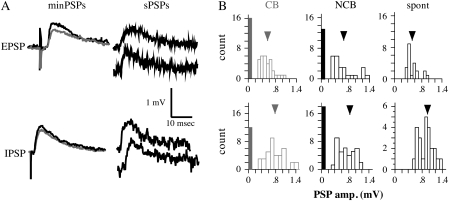
Figure 2.
Examples of minimal PSPs. (A) Left: mean minimal PSPs evoked by CB (gray) and NCB (black) stimulation. Stimulation intensities for minimal EPSPs were 0.016 mA for CB and 0.023 mA for NCB, and for minimal IPSPs were 0.02 mA for CB and 0.025 mA for NCB; stimuli were 300 μm horizontal from the cell. Right: Examples of spontaneous PSPs from the same neurons. (B) Amplitude distributions for minimal PSPs from CB (left) and NCB (center) stimulation, and for spontaneous PSPs (right). Open bars are the numbers of minimal PSPs in the indicated amplitude bins. The filled bars represent the number of events classed as failures, and the arrowheads indicate the mean amplitude.

