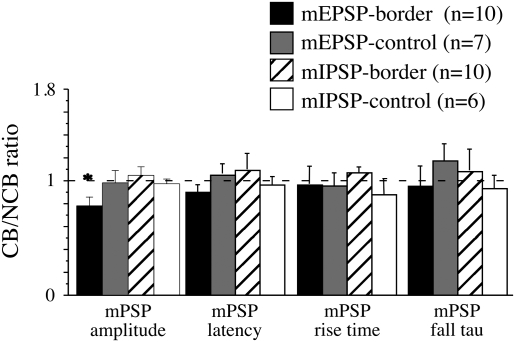
Figure 3.
CB/NCB ratio for the amplitudes, latencies, rise times, and fall taus of minimal PSPs. n = the number of cells for each group. The bars represent the mean CB/NCB ratio. Error bars are the SEM. The dotted line indicates a value of 1, which indicates no difference between the values obtained with CB and NCB stimulation. *Significantly different from other amplitude ratios, P < 0.01, 1-way ANOVA followed by post hoc Fisher's protected least-significant difference (PLSD) tests.

