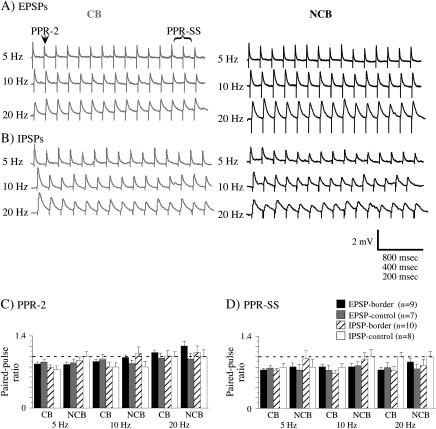
Figure 6.
Examples of trains of EPSPs (A) and IPSPs (B) evoked by CB (gray) and NCB (black) stimulation at various frequencies. The time scale is equal to 800, 400, 200, ms for 5, 10, 20 Hz, respectively. Two ratios were used to quantify these trains: PPR-2, in which the amplitude of the second PSP was divided by the first; and PPR-SS, in which the mean amplitude of the last 3 PSPs was divided by the amplitude of the first. The mean values of PPR-2 (C) and PPR-SS are plotted in (C) and (D). The error bars are the SEM. n = the number of cells in each group. The dotted line indicates a value of 1, which indicates no difference in amplitude between first and second PSPs (PPR-2) or first and last PSPs (PPR-SS). Note that no values differ significantly between corresponding CB and NCB stimulation (1-way ANOVA).

