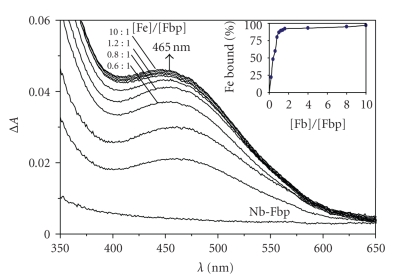
Figure 5.
Displacement of NbV from Nb2-Fbp (prepared by incubating apoFbp (100 μM) with 10 mol equiv 1 : 2 Nb : NTA under the same conditions as Figure 2(a)) by 1 : 2 Fe : NTA in the same buffer at 310 K. the band at ca.465 nm increases in intensity with the addition of FeIII. Molar ratios r [Fe]/[Fbp] from bottom to top: are 0, 0.2, 0.4, 0.6, 0.8, 1.0, 1.2, 1.4, 1.6, 4, 8, and 10. Insert shows variation in percentage of FeIII bound to the protein calculated from the LMCT band at 465 nm with the amount of added FeIII.

