
Figure 5.
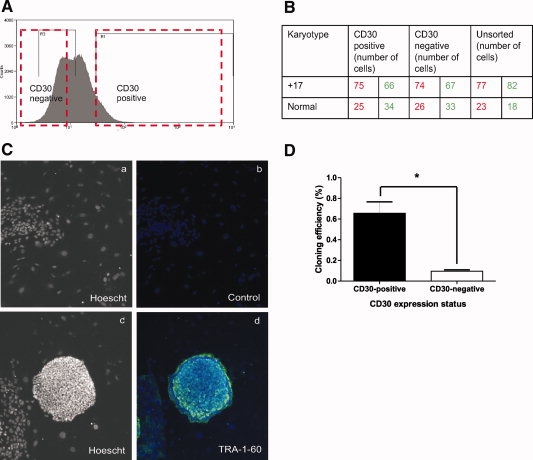
Fluorescent sorting of H7.s9 cells based on CD30 expression. (A): Cells sorted for cytogenetic and clonogenic analyses, with the boxed areas representing the CD30 positive and negative fractions taken. (B): Number of normal and abnormal cells in the fractions analyzed, assessed by fluorescent in situ hybridization. The data shown is from two separate assays, with data from the first assay in red, and the second assay in green. (C): TRA-1-60 expression in hESC derived from CD30-positive H7.s9 cells: Hoescht only (Ca, Cc), FITC-conjugated secondary antibody-only control and Hoescht (Cb), TRA-160 and Hoescht (Cd) (original magnification, ×4). (D): Cloning efficiency of the CD30-positive and CD30-negative populations, the CD30-positive population has a significantly higher cloning efficiency (Student's t test, p ≤ .05, n ≥ 3).