Figure 4.

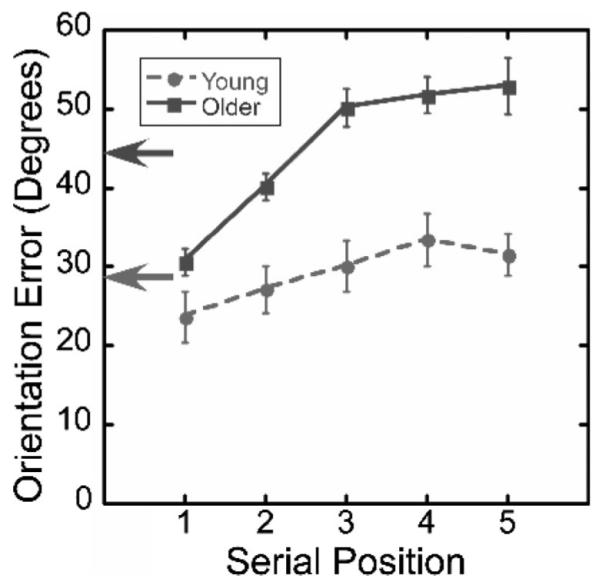
Mean orientation error in Experiment 1. The arrows indicate the overall mean orientation error for each age group. The x-axis represents the serial order of the movement segment. Error bars are standard errors of the mean.

Mean orientation error in Experiment 1. The arrows indicate the overall mean orientation error for each age group. The x-axis represents the serial order of the movement segment. Error bars are standard errors of the mean.