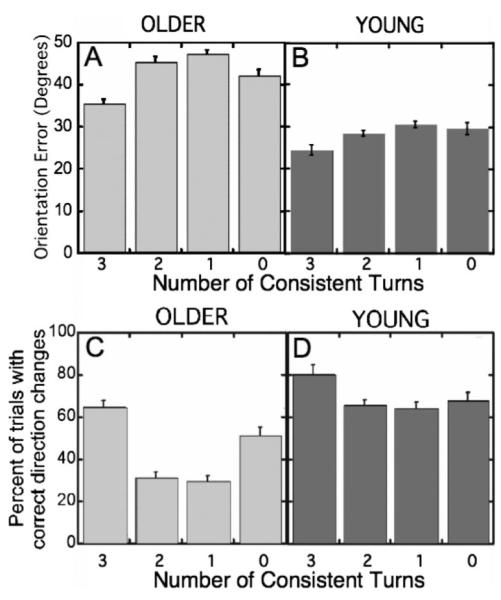
Figure 6.

Reproduction fidelity as a function of the number of consistent turns in a stimulus for older and young adults. Figures 6A and 6B express reproduction fidelity in terms of mean orientation errors. Figures 6C and 6D express imitation fidelity in terms of the percent of trials on which an imitation’s pattern of turn consistencies matched the stimulus’s pattern of turn consistencies. Error bars represent within-subject standard error (Loftus & Masson, 1994).
