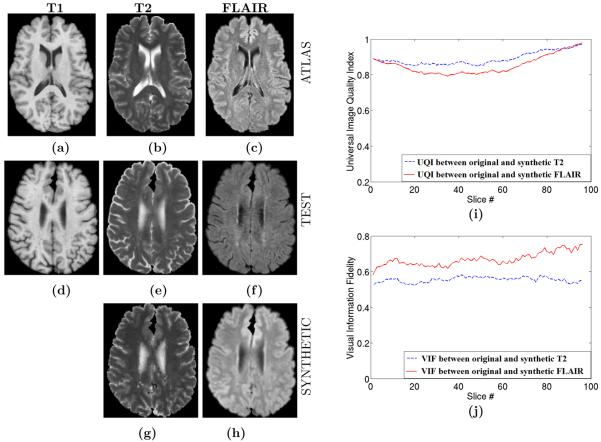
Figure 4.
Contrast Synthesis on Real Data : (a) T1 Atlas, (b) T2 Atlas, (c) FLAIR Atlas, (d) Test T1, (e) true test T2, (f) true test FLAIR, (g) synthetic T2, (g) synthetic FLAIR, (i) Universal Image Quality Index21 between original and synthetic T2/FLAIR, (j) Visual Information Fidelity22 between original and synthetic T2/FLAIR for each slice of the volume. Normalized Mutual Information (NMI) between (e) and (g) is 0.7464 while NMI between (f) and (h) is 0.7597. The atlas FLAIR has a better contrast in GM-WM boundary compared to the subject FLAIR. As a consequence, the synthetic FLAIR has better GM-WM contrast than the subject. This highlights the benefits of our method. As the synthetic image intensities are taken from the atlas, a new contrast is “created”.

