
Figure 3.
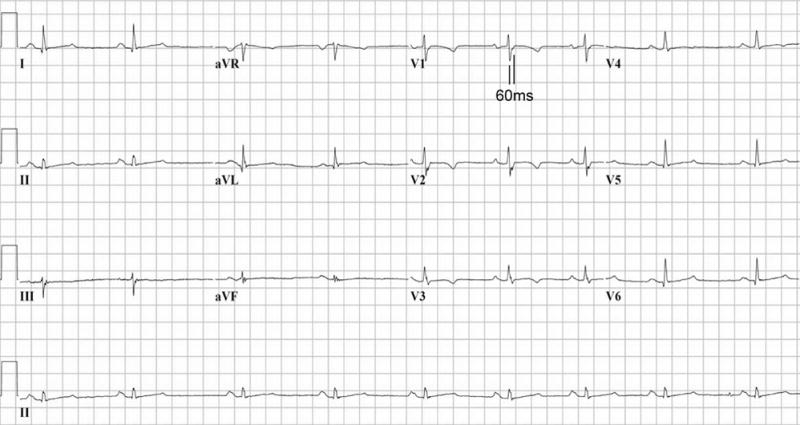
ECG from proband with T wave inversion in V1 – V4 and prolongation of the terminal activation duration ≥ 55 msecs measured from the nadir of the S wave to the end of the QRS complex in V1. (Contributed by MGPJ Cox, Utrecht, The Netherlands)