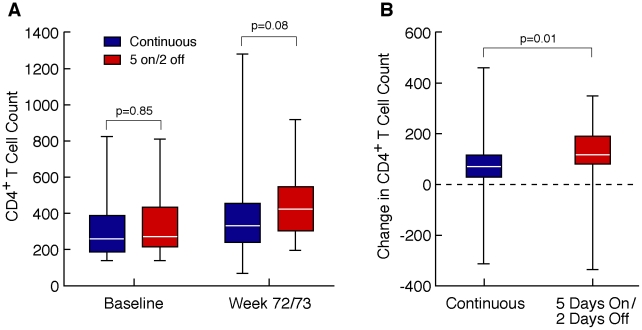
Figure 3. A. Change in CD4+ T cells for participants successfully completing 72/73 weeks.
The CD4+ T cell counts in the continuously treated (N = 40) and in the 5 days on/2 days off (N = 46) arms were similar at baseline (255 and 271/mm3, respectively, p = 0.85) and marginally different at week 72/73 (330 and 429/mm3, respectively, p = 0.08). B. The median paired difference in CD4+ T cells between baseline and week 72/73 was greater in the 5 days on/2 days off group (114/mm3) than in the continuously treated group (68/mm3). (p = 0.01). The lines across the box indicates the median values; the boxes contain the 25–75% interquartile range; and the whiskers extend to the highest and lowest values.

