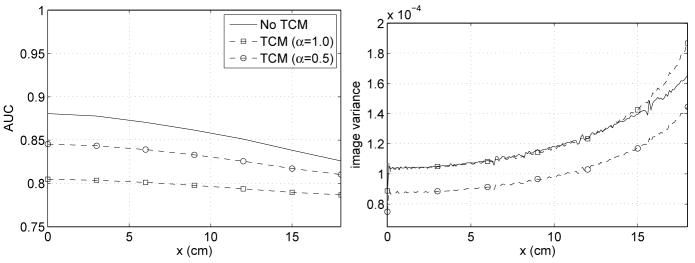
Figure 10.
AUC value and variance profile for detection of a lesion placed at various locations on the x-axis. The lesion is embedded in a centered, ellipse-shaped water phantom (width: 38 cm, height: 25 cm). Data acquisition is performed with a bowtie filter. The solid curve corresponds to data acquisition with no tube current modulation (TCM), while the dashed curves correspond to using tube current modulation with either α = 1.0 (squares) or α = 0.5 (circles).

