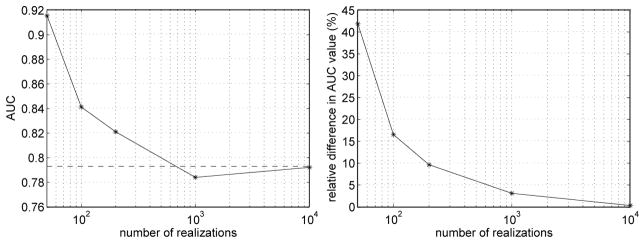
Figure 7.
Monte Carlo estimates of the AUC value at (x, y) = (4, −7) cm in the Forbild head phantom of Figure 3., with a progressive increase in the number of noise realizations. (Left) The horizontal dashed line gives the analytical estimate of the AUC value, while the solid curve gives the Monte Carlo estimate. (Right) Relative difference between the Monte Carlo estimate and the analytical estimate. The figure-of-merit is 100 × |1 − (a1 − 0.5)/(a2 − 0.5)| where a1 and a2 are the Monte-Carlo and the analytical estimates, respectively. The substraction of 0.5 is used to account for the fact that the range of the AUC is [0.5, 1].

