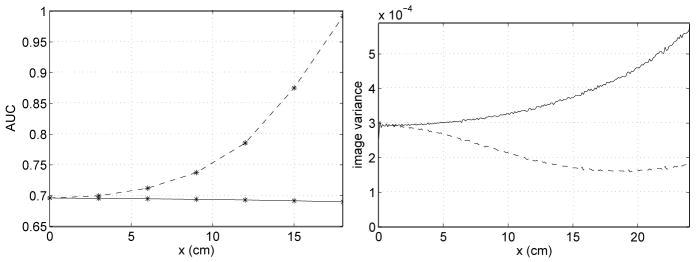
Figure 8.
AUC value and variance profile for detection of a lesion placed at various locations on the x-axis; the lesion is embedded in a centered, circular water phantom of diameter 38 cm. The dashed curve corresponds to data acquisition with no bowtie filter, while the solid curve corresponds to using a bowtie filter.

