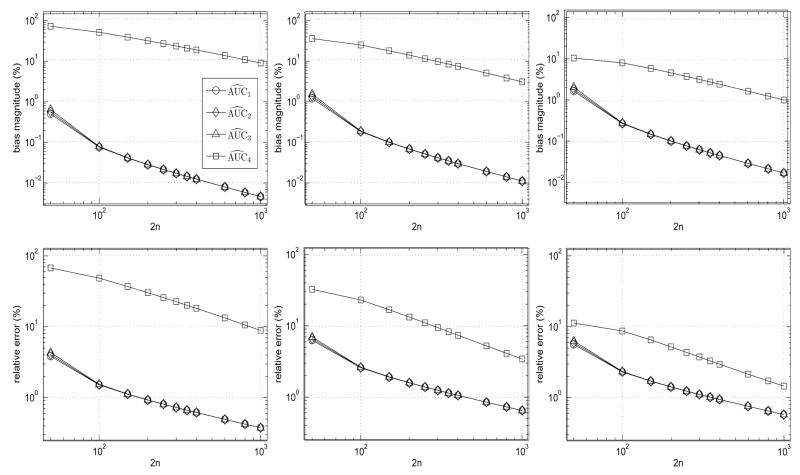
Fig. 2.
Bias magnitude and relative error of AUC estimators as a function of the total number of images, 2n. The plots assume p = 40 channels with AUC = 0.6 (left), 0.75 (middle), and 0.9 (right). Bias magnitude is on the top and relative error is on the bottom. The estimators are (circles), (diamonds), (triangles), (squares). For each i ∈ {1, 2, 3, 4}, is calculated by substituting the square root of θ̂i for SNR in equation (5). The bias magnitude (in %) for an AUC estimator, , is calculated as . The relative error (in %) is calculated as , where MSE denotes the mean-square error.

