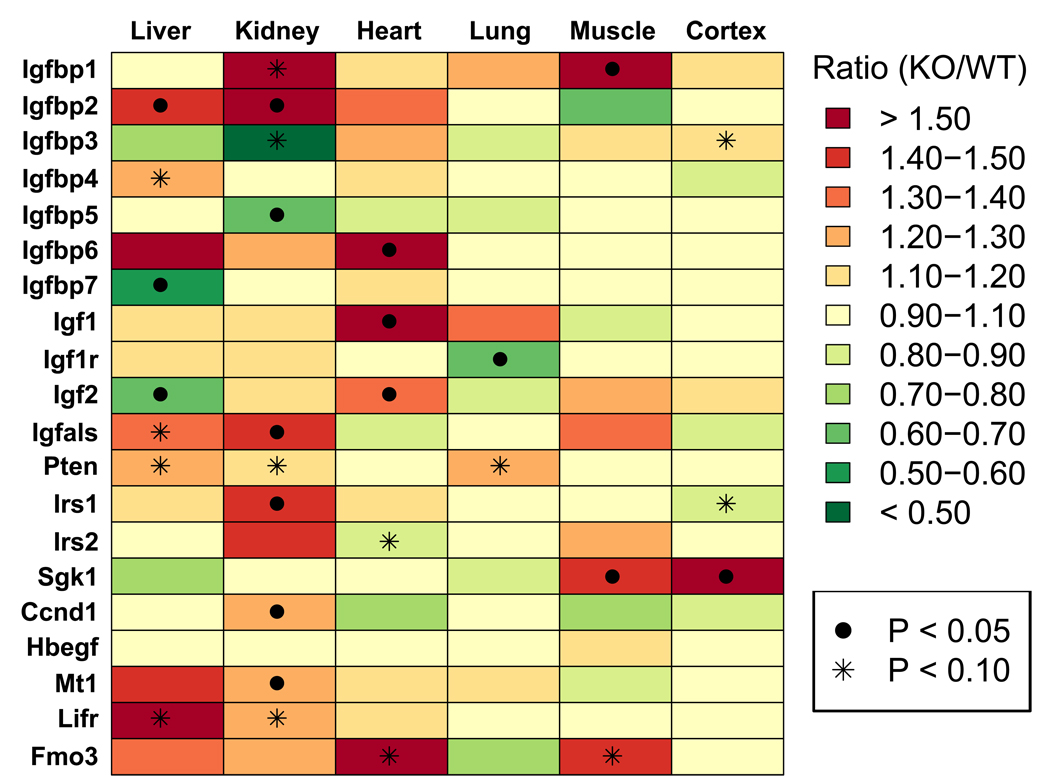
Figure 2.
Relative expression of IGF-associated genes in PappA(−/−) mice and wild-type littermates with respect to six organs (liver, heart, kidney, muscle, lung and neocortex) (RT-PCR). Colors correspond to the estimated ratio of expression in PappA(−/−) relative to wild type littermates (n = 6 mice per treatment). Red colors correspond to increased expression in PappA(−/−) mice relative to controls, while green colors correspond to decreased expression in PappA(−/−) mice relative to controls (see color chart). Significant effects of the PappA(−/−) mutation are indicated by the ● symbol (P < 0.05; two-sample t-test or rank-sum test). Marginally significant effects of the PappA(−/−) mutation are indicated by the * symbol (0.05 < P < 0.10; two-sample t-test or rank-sum test). Calculations were performed using the ΔΔCt method with expression of either 18S ribosomal RNA (Rn18s) or glyceraldehyde-3-phosphate dehydrogenase (Gapdh) used as an internal reference gene. The full gene name associated with each gene symbol is provided in Supplemental Data File 1.

