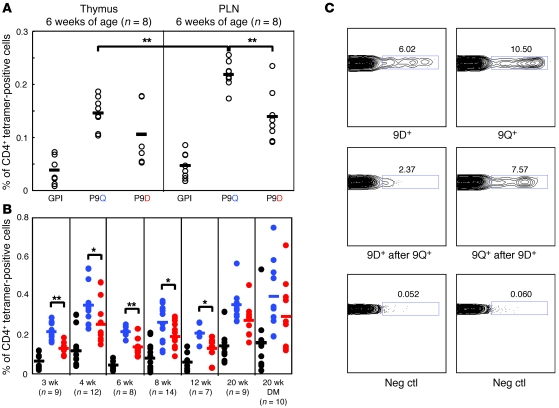
Figure 1. In vivo expansion of 2.5mi reactive T cells against either a negatively charged P9 peptide (Asp) or a neutral P9 peptide (Gln).
(A) Both tetramer+ cell populations are present in the thymus and expand in the periphery (pancreatic lymph nodes [PLN]). I-Ag7GPI282–292 was used as a negative control. Individual data points show the percentage of tetramer-positive cells for 1 mouse. (B) Modulation of the 2 populations over time in the pancreatic lymph nodes. DM indicates diabetic mice. *P < 0.05; **P < 0.01. Color scheme: black, I-Ag7GPI282–292; blue, I-Ag7 2.5 mi 9Q; red, I-Ag7 2.5mi 9D. (C) 2.5mi T cell–reactive populations purified from 6-week-old NOD female mice spleens using I-Ag7 2.5mi 9D or 9Q tetramers and enriched with anti-PE beads on an autoMACS machine (top panel). The same experiment after first depleting either the 9D or 9Q T cell–reactive population (middle panel). Negative controls are CD4+ tetramer–negative cells (bottom panel). Displayed percentages are relative to the sorted CD4+ population.

