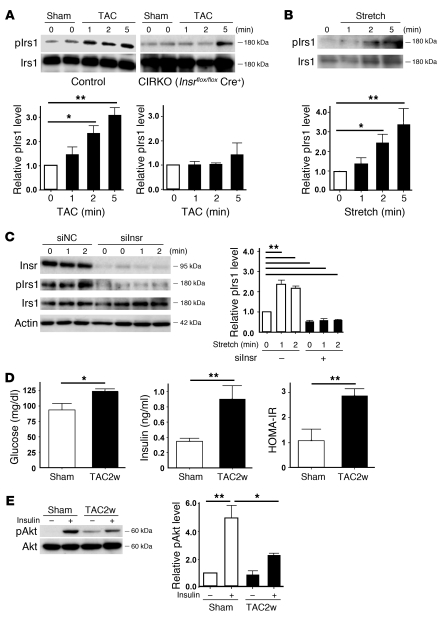
Figure 7. Mechanism of enhanced insulin signaling in the heart during pressure overload.
(A) CIRKO mice (Insrflox/floxCre+) or littermate controls were subjected to TAC or sham operation, and heart samples were obtained at the indicated times. pIrs1 levels were examined by Western blot analysis. The graphs indicate relative expression levels of pIrs1. n = 3. (B) Cardiomyocytes were subjected to mechanical stretch and pIrs1 levels were examined by Western blot analysis. n = 3. (C) siRNA targeting Insr (siInsr) or negative control RNA (siNC) was introduced into cardiomyocytes, after which the cells were subjected to mechanical stretch. pIrs1 levels were examined by Western blot analysis. n = 3. (D) Plasma glucose and insulin levels were examined at 2 weeks after TAC. n = 7–8. (E) Insulin-induced phosphorylation of Akt (pAkt) in the liver was examined after TAC or sham operation. n = 3. Data are shown as mean ± SEM. *P < 0.05; **P < 0.01.

