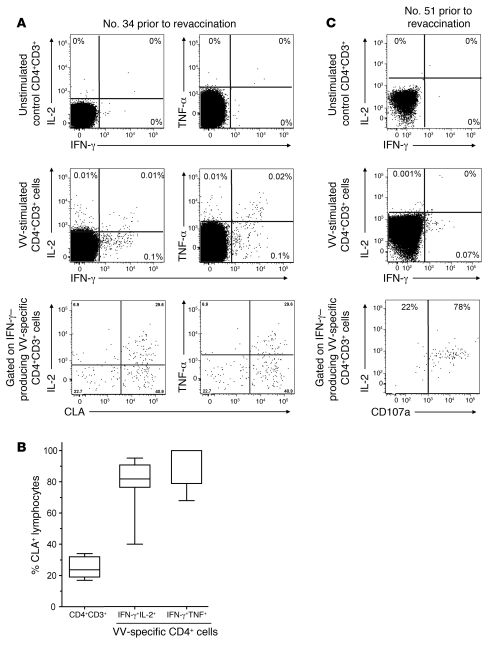
Figure 6. CLA and CD107a cytotoxic effector molecule on VV-specific CD4 cells in previously vaccinated volunteers.
(A) PBMCs prior to revaccination were thawed and stimulated for 16 hours with VV and harvested for flow cytometric assays. Multiparametric flow cytometric analyses of IL-2, IFN-γ, and/or TNF-α and gated on CD3+CD4+ as indicated using FlowJo software. Flow cytometric analyses of the basal level of cytokine production by unstimulated CD3+CD4+ cells are shown in the upper panels. We showed percentages of VV-specific CD3+CD4+ cells producing IFN-γ and/or IL-2 (middle, left) and of CD3+CD4+ cells producing IFN-γ and/or TNF-α (middle, right) for a representative individual. Flow cytometric analyses of CLA-expressing cells among VV-specific CD4+ cells producing IFN-γ (bottom). Data are representative of 10 individuals tested. (B) Box-and-whiskers representation of the frequency of VV-specific CD3+CD4+ lymphocytes expressing CLA markers is presented for 10 vaccinated volunteers. The data show the median values and the 10th, 25th, 75th, and 90th percentiles. (C) The expression of CD107a cytotoxic effector molecule was analyzed for 3 vaccinated volunteers. This latter population represents 79%–85% of VV-specific CD4+ cells producing IFN-γ and/or IL-2 in all volunteers tested. Representative plot for CD107a marker gated on CD3+CD4+ cells producing IFN-γ (C, bottom).

