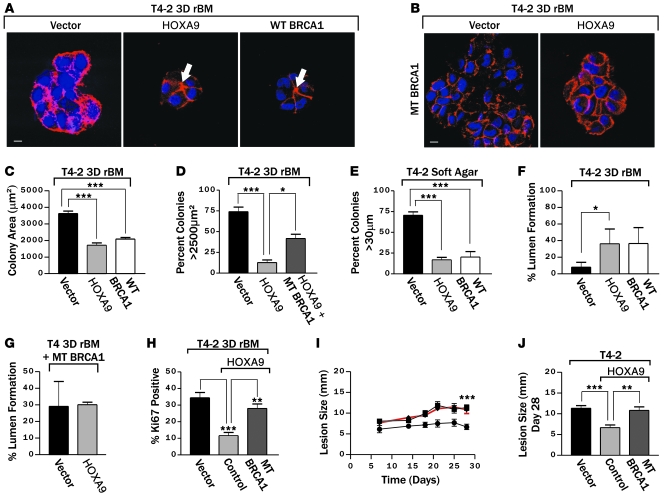
Figure 5. HOXA9 regulates BRCA1 to repress the malignant behavior of MECs.
(A) Immunofluorescence images of β-catenin (red) and nuclei (blue) in T4-2 colonies reexpressing HOXA9 or BRCA1. Arrows indicate cleared lumens. Scale bar: 10 μm. (B) Immunofluorescence images of β-catenin (red) and nuclei (blue) in T4-2 colonies reexpressing HOXA9 alone or with a mutant BRCA1. Scale bar: 10 μm. (C) Quantification of colony size of T4-2 cells reexpressing HOXA9 or BRCA1. ***P = 0.001. (D) Quantification of cross-sectional area of T4-2 colonies formed by cells reexpressing HOXA9 alone or with a mutant BRCA1. *P = 0.05, ***P = 0.001. (E) Quantification of anchorage-independent growth and survival in T4-2 cells reexpressing either HOXA9 or BRCA1. ***P = 0.001. (F) Quantification of the percentage of T4-2 colonies that formed lumens following the reexpression of HOXA9 or BRCA1. *P = 0.0263. (G) Quantification of lumen formation in rBM T4-2 colonies with reexpressed HOXA9, when BRCA1 function has been compromised through coexpression of a mutant BRCA1. (H) Quantification of proliferation in T4-2 cells following HOXA9 reexpression with a mutant BRCA1. **P = 0.0025, ***P = 0.0003. (I) The time course of the progressive increase in xenograft size (5–30 days). Reexpression of HOXA9 in T4-2 tumor cells significantly reduced the rate of lesion expansion (filled circles) compared with the T4-2 vector controls (filled squares), which could be restored to that of T4-2 breast tumor cells if coexpressed with a mutant BRCA1 (filled triangles with red line). ***P = 0.001. (J) Lesion size (28 days) in each experimental group. **P = 0.01, ***P = 0.001.

