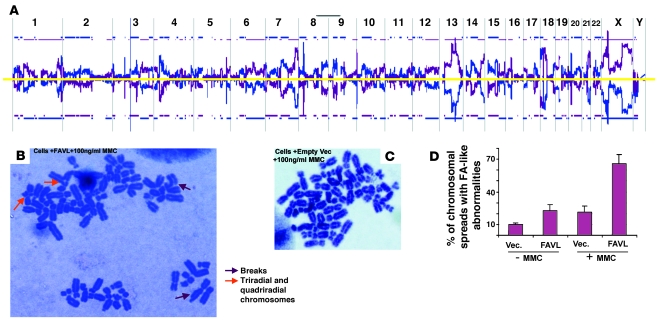
Figure 6. Overexpression of FAVL leads to chromosomal instability.
(A) Genomic DNA was isolated from control U2OS cells and U2OS cells with elevated levels of FAVL, respectively. Both DNA samples were sent to MOgene LC for array CGH analysis through the dye swap approach. Chromosomal alterations occurred on nearly all chromosomes of cells with elevated levels of FAVL, standardized by control cells (blue line) and elevated levels of FAVL (purple line). Blue and purple lines appearing above or below the yellow line stand for DNA amplification and deletion, respectively. Representative raw data for chromosome 1 and also for chromosome Y (essentially negative, consistent with the origin of U2OS cells) are provided (Supplemental Figure 6A). (B–D) The chromosomal spreads were prepared by using U2OS stable cell pairs, and typical FA-like chromosomal abnormalities were highly associated with U2OS cells expressing FAVL at a high level. The population of U2OS cells overexpressing FAVL (B) has a higher percentage of FA-like chromosomal changes compared with control cells with empty vectors (C), with or without mitomycin C treatment. There are broken, triradial, and quadriradial chromosomes in FAVL-overexpressed cells (B), which are cytogenetic features of FA cells. These tumor cells carry a considerable amount of aneuploidy spreads, which remained similar between 2 types of cells. Original magnification, ×1,000. (D) Average percentage of FA-like chromosomal spreads ± SEM (n = 3).

