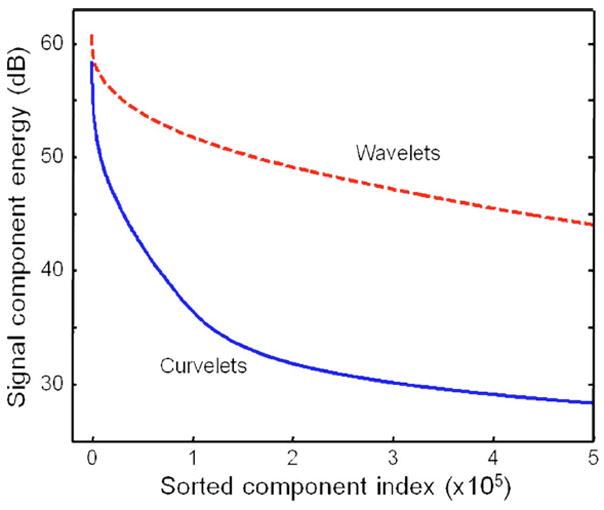
Fig. 1.

(Color online) Energies of the curvelet and wavelet coefficients of the OCT image shown in Fig. 2(a). The coefficients are sorted in descending order of energy from left to right. Curvelets provide a sparser representation of the image, as the signal energy is concentrated in fewer curvelet coefficients than wavelet coefficients.
