
Figure 5.
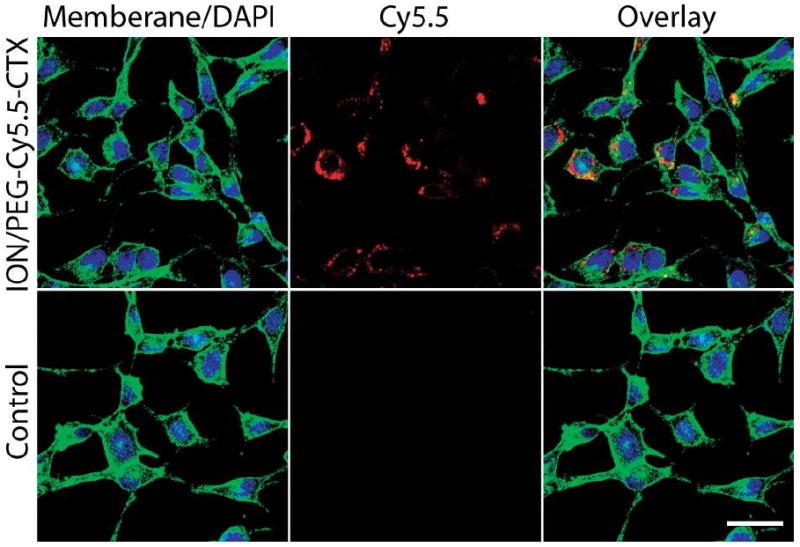
Confocal fluorescence images of 9L cells incubated with 100 μg of Fe/ml ION/PEG-CTX-Cy5.5 for one hour (top row) and control cells (bottom row). The cellular membranes are highlighted in green, the nuclei in blue, and the NIFR signal associated with the Cy5.5 on nanoparticles is displayed in red. The scale bar corresponds to 30 μm.