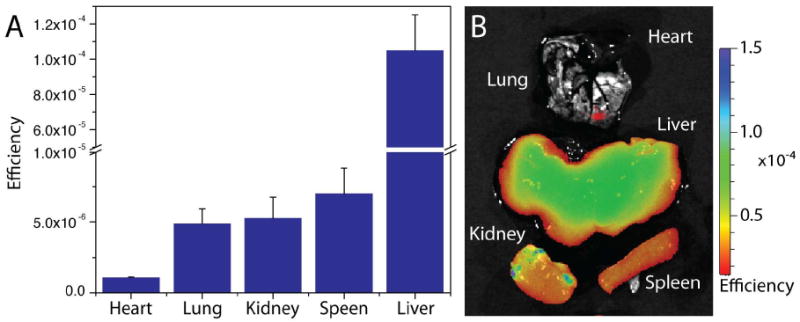
Figure 7.

Biodistribution of ION/PEG-CTX-Cy5.5. (A) Relative accumulation of ION/PEG-CTX-Cy5.5 in select tissues of mice ∼72 hrs after injection (∼10 mg Fe/kg). Error bars represent standard deviation of measurements from individual animals (n = 3). (B) Representative ex vivo NIRF image of mouse tissues after injected with ION/PEG-CTX-Cy5.5.
