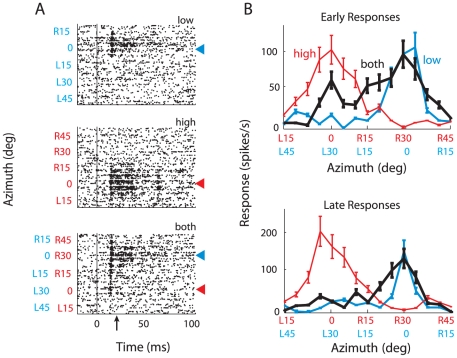
Figure 3. Neural responses at a sample site to individual sounds alone and to paired sounds separated in azimuth.
The stimuli were positioned relative to the broadband RF center. A. Raster plots representing responses to the low frequency sound alone (top raster), the high frequency sound alone (middle raster), or both sounds presented together (bottom raster). When both sounds were presented together, the high and low frequency sounds were separated in virtual space by 30°. The position of the low frequency sound is written in blue type on the y-axis, and the position of the high frequency sound is in red type on the y-axis. The values of the low and the high stimuli differed by 30°, reflecting the spatial displacement between the two stimuli. Sound onset = 0 ms; upward arrow indicates 20 ms, the demarcation between early and late responses. Red arrowheads indicate high frequency center; blue arrowheads, low frequency center. B. Same data as in A, but displayed as tuning curves representing average response rates plotted separately for the early (top; 0–20 ms) and late (bottom; 20–50 ms) time period. Red curves represent responses to the high frequency sound alone, blue curves to the low frequency sound alone, and black curves to both sounds together. The position of the low frequency sound is written in blue type on the x-axis, and the position of the high frequency sound is in red type on the x-axis.

