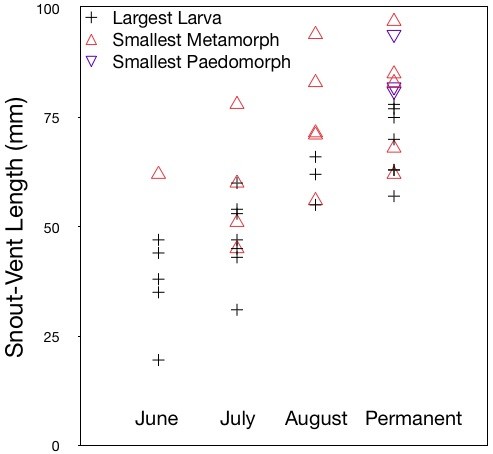
Figure 3.

Maximum larval size and minimum size at maturity increase with hydroperiod. Each point represents size category for a single pond-year 2006-2008. Black crosses show SVL of largest larva found in each pond-year; red triangles show SVL of smallest metamorph found in each pond-year; inverted blue triangles show SVL of smallest paedomorph in each pond-year. Pond-years categorized by hydroperiod into locations that dried in June, July, August, and locations that did not dry (Permanent).
