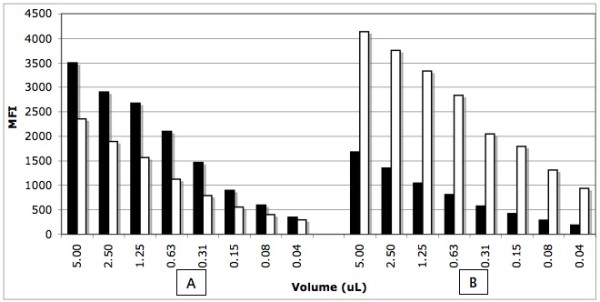
Figure 2.

Effect of the DNA concentration of the kinetic of hybridization. Panel A; homozygous wild type DNA, panel B: homozygous mutated DNA. Black bars correspond to the wild type probe (V617Fwt) and white bars correspond to mutated probe (V617Fmut). MFI: median fluorescent intensity.
